
- Software - Simulation
- Software
- Server software
- HGL Dynamics
Server software Aurora DataVieweranalysisfor aeronautics

Add to favorites
Compare this product
Characteristics
- Function
- server, analysis
- Applications
- for aeronautics
Description
Time & Frequency domain visualisation & analysis
Worldwide connectivity – Thin Client/Server Architecture
Interactive viewing & cursor interrogation
Mode definition & alignment
Order & mode tracking
Phase analysis with Cartesian and Polar plots
Third-octave analysis (also 1/6, 1/12, 1/24)
Rainflow and cycle-counting analysis
More features:
Shaft Centre-line & Orbit analysis
Data Manipulation and Derived Channel Generation
Data validation – remove erroneous data from analysis
Data tagging – highlight regions of specific interest
Workflow Persistency – the system ‘remembers’ previous analysis and recreates it when reloading a data file
Multi-function plot types
User-configurable displays
User-definable colour maps
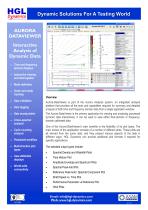
Aurora-DataViewer is part of the Aurora Analysis system, an integrated analysis platform that provides all the tools and capabilities required for summary and detailed analysis of both time and frequency domain data from a single application window.
The Aurora-DataViewer is the primary application for viewing and analysing processed dynamic data interactively. It can be used to view either time-domain or frequency-domain calibrated data.
The standard plot displays include:
Spectral Density and Waterfall Plots
Time History Plot
Amplitude Envelope and Spectrum Plots
Spectral Peak-hold Plot
Reference Peak-hold / Spectral Component Plot
Catalogs


Other HGL Dynamics products
Analysis


*Prices are pre-tax. They exclude delivery charges and customs duties and do not include additional charges for installation or activation options. Prices are indicative only and may vary by country, with changes to the cost of raw materials and exchange rates.